
How to Configure the cascade replication On PostgreSQL ?
PostgreSQL Cascade Replication Scenario:
- The cascading replication feature allows a standby server to accept replication connections and stream WAL records to other standbys, acting as a relay. This can be used to reduce the number of direct connections to the master and also to minimize inter-site bandwidth overheads.
- If an upstream standby server is promoted to become new master, downstream servers will continue to stream from the new master if recovery_target_timeline is set to ‘latest’.
- A Upstream standby acting as both a receiver and a sender is known as a cascading standby.
- Actual Scenario is You will need to set primary_conninfo in the downstream standby to point to the cascading standby
logic and working principle of Cascading Replication:
- The following is my setup denotes physical streaming replication PSR
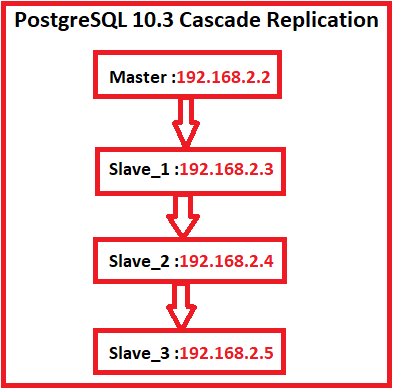
- Master(primary) -> Slave1(Upstream Standby) -> Slave2(DownStream Standby)
- This behaves correctly – changes on Master reflect in Slave1, and then Salve1 reflect to Slave2.
- If I disable Master, and promote Slave1 to a Master using a trigger_file then Slave1 is promoted successfully as a Master and I can write to Slave1.
- However, streaming replication continues between the newly promoted Slave1 and Downstream Slave2.
1. Edit pg_hba.conf to enable replication connections.
2. Edit postgresql.conf to turn on the various replication options.
3. Restart the master.
4. Set up passwordless access to the master from the first replica and second replica.
5. Use rsync backup and send it to slave server
6. Create a recovery.conf pointing at the master.
7. Edit second slave recovery.conf to point at the first replica.
8. Start the first replica then.
9. Start the second replica.
Total IP LIST:
Master IP :192.168.2.2
Slave_1 IP :192.168.2.3
Slave_2 IP :192.168.2.4
Adding one more extra slave IP:192.1682.5
Directories:
master data: /mnt/DATA
slave_1 data: /DATA
slave_2 data: /DATA
Slave_3 data:/var/lib/pgsql/10/data/
bin location:/usr/pgsql-10/bin
At master:
Step 1:Create one replication user on master server
psql -c "CREATE USER rep REPLICATION LOGIN ENCRYPTED PASSWORD 'redhat';"
Note:rep user not mandatory im using Postgres user becouse postgres user having privillege of replication so don’t worry about rep user
Step 2:change the PostgreSQL Replication parameter as per requirments:
AT master postgresql.conf:
listen_addresses = 'localhost,192.168.2.2'
port = 5432
wal_level = 'hot_standby'       # minimal, archive, hot_standby, or logical
max_wal_senders = 5             # max number of walsender processes
                                # (change requires restart)
wal_keep_segments = 64          # in logfile segments, 16MB each; 0 disables
#hot_standby = on                #only for slave
archive_mode = on               # allows archiving to be done
archive_command =  'rsync -av %p /mnt/archive/%f && rsync -av %p postgres@192.168.2.3:/ARCHIVE/%f' # or 'cd .'
Step 3: At master pg_haba.conf file put the slave_1 and slave_2 information :
master pg_hba.conf:
host    replication     postgres             192.168.2.3/32         trust
Step 4:Restart the master server
$ /usr/pgsql-10/bin/pg_ctl -D /mnt/DATA/ restart -m fast
Step 5:Stop the both Slave server:
At Slave_1:
$ /usr/pgsql-10/bin/pg_ctl  -D /DATA stop

At Slave_2:
/usr/pgsql-10/bin/pg_ctl  -D /var/lib/pgsql/9.4/data stop
Step 6:Remove or move the Existing data directories of slave_1 & slave_2 server :
At Slave_1:
 rm  -rf /var/lib/pgsql/10/data/*

At Slave_2:
 rm  -rf /var/lib/pgsql/10/data/*
Step 7: Take the master server as backup mode and send the master’s physical backup from master to slave_1 and slave_2 :
At master:
psql -c "select pg_start_backup('initial_backup');"
$ rsync -cva --inplace  /mnt/DATA/* postgres@192.168.2.3:/DATA/
$ rsync -cva --inplace  /mnt/DATA/* postgres@192.168.2.4:/DATA/
psql -c "select pg_stop_backup();"
AT SLAVE_1
Step 8: Now open postgresql.conf in Slave_1, and make below changes
AT Slave_1 postgresql.conf:
listen_addresses = 'localhost,192.168.2.3'
port = 5432
wal_level = 'hot_standby'       # minimal, archive, hot_standby, or logical
max_wal_senders = 10             # max number of walsender processes
                                # (change requires restart)
wal_keep_segments = 64          # in logfile segments, 16MB each; 0 disables
hot_standby = on
archive_mode = on               # allows archiving to be done
archive_command =  'rsync -av %p /archive/%f && rsync -av %p postgres@172.18.2.190:/archive/%f' # or 'cd .'
Step 9:Open pg_hba.conf and make below changes At Slave_1:
host    replication     postgres            192.168.2.2/32  trust
host    replication     postgres            192.168.2.4/32  trust
Step 10:And finally create a recovery.conf file under data folder. recovery.conf should be like this:
$ cat /DATA/recovery.conf
standby_mode = 'on'      # to enable the standby (read-only) mode.
primary_conninfo = 'host=192.168.2.2 port=5432 user=postgres password=postgres'
                         # to specify a connection info to the master node.
recovery_target_timeline = 'latest'


trigger_file = '/tmp/pg_failover_trigger'
                         # to specify a trigger file to recognize a fail over.
restore_command = 'cp /archive/%f "%p"'
archive_cleanup_command = '/usr/pgsql-9.4/bin/pg_archivecleanup /archive %r'
Step 11.Now open postgresql.conf in Slave_2, and make below changes
AT Slave_2 postgresql.conf:
listen_addresses = 'localhost,192.168.2.4'
port = 5432
wal_level = 'hot_standby'       # minimal, archive, hot_standby, or logical
max_wal_senders = 10             # max number of walsender processes
                                # (change requires restart)
wal_keep_segments = 64          # in logfile segments, 16MB each; 0 disables
hot_standby = on
archive_mode = on               # allows archiving to be done
archive_command =  'rsync -av %p /archive/%f' # or 'cd .'
Step 12.recovery.conf at Slave_2:
cat recovery.conf
standby_mode='on'
primary_conninfo = 'host=192.168.2.3 port=5432 user=postgres password=postgres'

restore_command = 'cp /archive/%f "%p"'
archive_cleanup_command = '/usr/pgsql-9.4/bin/pg_archivecleanup /archive %r'
recovery_target_timeline = 'latest'
step 13.Open pg_hba.conf and make below changes At Slave_2:
host replication postgres 192.168.2.3/32 trust
step 14. start the master(already started no need t start),slave_1 & slave_2 using pg_ctl
MASTER:
$ /usr/pgsql-10/bin/pg_ctl -D /mnt/DATA/ start
waiting for server to start....2018-03-13 15:48:00.427 IST [12832] LOG:  listening on IPv6 address "::1%1", port 5432
2018-03-13 15:48:00.427 IST [12832] LOG:  listening on IPv4 address "127.0.0.1", port 5432
2018-03-13 15:48:00.429 IST [12832] LOG:  listening on IPv4 address "192.168.2.2", port 5432
2018-03-13 15:48:00.431 IST [12832] LOG:  listening on Unix socket "/var/run/postgresql/.s.PGSQL.5432"
2018-03-13 15:48:00.435 IST [12832] LOG:  listening on Unix socket "/tmp/.s.PGSQL.5432"
2018-03-13 15:48:00.991 IST [12832] LOG:  redirecting log output to logging collector process
2018-03-13 15:48:00.991 IST [12832] HINT:  Future log output will appear in directory "log".
 done
server started
SLAVE_1:
$ /usr/pgsql-10/bin/pg_ctl -D /DATA/ start
waiting for server to start....2018-03-13 15:49:01.647 IST [11561] LOG:  listening on IPv6 address "::1%1", port 5432
2018-03-13 15:49:01.647 IST [11561] LOG:  listening on IPv4 address "127.0.0.1", port 5432
2018-03-13 15:49:01.655 IST [11561] LOG:  listening on IPv4 address "192.168.2.3", port 5432
2018-03-13 15:49:01.659 IST [11561] LOG:  listening on Unix socket "/var/run/postgresql/.s.PGSQL.5432"
2018-03-13 15:49:01.743 IST [11561] LOG:  listening on Unix socket "/tmp/.s.PGSQL.5432"
2018-03-13 15:49:01.933 IST [11561] LOG:  redirecting log output to logging collector process
2018-03-13 15:49:01.933 IST [11561] HINT:  Future log output will appear in directory "log".
 done
server started
SLAVE_2:
/usr/pgsql-10/bin/pg_ctl -D /DATA/ start
waiting for server to start....2018-03-13 15:49:11.146 IST [11927] LOG:  listening on IPv6 address "::1%1", port 5432
2018-03-13 15:49:11.146 IST [11927] LOG:  listening on IPv4 address "127.0.0.1", port 5432
2018-03-13 15:49:11.148 IST [11927] LOG:  listening on IPv4 address "192.168.2.4", port 5432
2018-03-13 15:49:11.149 IST [11927] LOG:  listening on Unix socket "/var/run/postgresql/.s.PGSQL.5432"
2018-03-13 15:49:11.152 IST [11927] LOG:  listening on Unix socket "/tmp/.s.PGSQL.5432"
2018-03-13 15:49:11.179 IST [11927] LOG:  redirecting log output to logging collector process
2018-03-13 15:49:11.179 IST [11927] HINT:  Future log output will appear in directory "log".
 done
server started
NOTE:
Slave_1 logs:
2017-10-03 16:43:30 BST @ LOG: 00000: selected new timeline ID: 2
Slave_2 logs:
017-10-03 16:43:30 BST @ DETAIL: End of WAL reached on timeline 1 at 0/190007A8.
so slave_2 did not switch over to timeline two after the promotion.
as I said , You need recovery_target_timeline=’latest’ in slave_1 recovery.conf
Monitoring the Cascading replication in Postgresql 10:
At MASTER:
1.create some dummy table check the slave server whther is replicated or not.
postgres=# create table t(id int);
CREATE TABLE

--check master server whether is recovery mode or not,master will not be recovery mode slave only will be recovery mode.
postgres=# select pg_is_in_recovery();
 pg_is_in_recovery
-------------------
 f
(1 row)
2.Using pg_stat_replication views
select client_addr,client_hostname,client_port,state,sent_lsn,write_lsn,flush_lsn,replay_lsn,write_lag,replay_lag,flush_lag,sync_state from pg_stat_replication;
 client_addr | client_hostname | client_port |   state   |  sent_lsn  | write_lsn  | flush_lsn  | replay_lsn |    write_lag    |   replay_lag    |    flush_lag    | sync_state
-------------+-----------------+-------------+-----------+------------+------------+------------+------------+-----------------+-----------------+-----------------+------------
 192.168.2.2 |                 |       42546 | streaming | 0/18017A50 | 0/18017A50 | 0/18017A50 | 0/18017A50 | 00:00:00.003582 | 00:00:00.003582 | 00:00:00.003582 | async
(1 row)
3.using linux command check the wal sender process whether started or not:
$ ps -ef|grep postgres
root       6563   6528  0 09:14 pts/2    00:00:00 su postgres
postgres   6564   6563  0 09:14 pts/2    00:00:00 bash
root      12770  12735  0 15:46 pts/0    00:00:00 su postgres
postgres  12771  12770  0 15:46 pts/0    00:00:00 bash
postgres  12832      1  0 15:47 pts/0    00:00:00 /usr/pgsql-10/bin/postgres -D /mnt/DATA
postgres  12833  12832  0 15:48 ?        00:00:00 postgres: logger process
postgres  12835  12832  0 15:48 ?        00:00:00 postgres: checkpointer process
postgres  12836  12832  0 15:48 ?        00:00:00 postgres: writer process
postgres  12837  12832  0 15:48 ?        00:00:00 postgres: wal writer process
postgres  12838  12832  0 15:48 ?        00:00:00 postgres: autovacuum launcher process
postgres  12839  12832  0 15:48 ?        00:00:00 postgres: archiver process
postgres  12840  12832  0 15:48 ?        00:00:00 postgres: stats collector process
postgres  12841  12832  0 15:48 ?        00:00:00 postgres: bgworker: logical replication launcher
postgres  12893  12832  0 15:49 ?        00:00:00 postgres: wal sender process postgres 192.168.2.3(57714) streaming 0/190001B0
postgres  12966  12771  0 15:54 pts/0    00:00:00 ps -ef
postgres  12967  12771  0 15:54 pts/0    00:00:00 grep --color=auto postgres
4.--you can calculate using this linux command how many wal sender is replicated to slave.
$ ps -ef|grep sender
postgres   7585   3383  0 15:59 ?        00:00:00 postgres: wal sender process postgres 192.168.2.2(42586) streaming 0/18017CD8
postgres   7598   6564  0 15:59 pts/2    00:00:00 grep --color=auto sender
At SLAVE_1:
1.check the previously created table on master whether is replicated or not on slave
postgres=# \dt
        List of relations
 Schema | Name | Type  |  Owner
--------+------+-------+----------
 public | t    | table | postgres
(1 row)
note:yes! it is successfully replicated the table.
--check the slave mode using following function whether is recovery mode or not
postgres=# select pg_is_in_recovery();
 pg_is_in_recovery
-------------------
 t
(1 row)

--and try to insert the valuse on slave server, slave is a read only mode it will not permitted write transaction.
postgres=# insert into t values(1);
ERROR:  cannot execute INSERT in a read-only transaction
2.using pg_stat_replication view:
select client_addr,client_hostname,client_port,state,sent_lsn,write_lsn,flush_lsn,replay_lsn,write_lag,replay_lag,flush_lag,sync_state from pg_stat_replication;
client_addr | client_hostname | client_port |   state   |  sent_lsn  | write_lsn  | flush_lsn  | replay_lsn | write_lag | replay_lag | flush_lag | sync_state
-------------+-----------------+-------------+-----------+------------+------------+------------+------------+-----------+------------+-----------+------------
 192.168.2.3 |                 |       57544 | streaming | 0/18017A50 | 0/18017A50 | 0/18017A50 | 0/18017A50 |           |            |           | async
(1 row)
3.using linux command you can monitor wether wal receiver is started or not,
this linux command will be helpful for finding out the postgres data directory
as well as postgres utility path means bin path

$ ps -ef|grep postgres
root       5740   5705  0 09:15 pts/1    00:00:00 su postgres
postgres   5741   5740  0 09:15 pts/1    00:00:00 bash
postgres  11434   5741  0 15:43 pts/1    00:00:00 tail -f log/postgresql-Fri.log
root      11478  11443  0 15:44 pts/3    00:00:00 su postgres
postgres  11479  11478  0 15:44 pts/3    00:00:00 bash
postgres  11561      1  0 15:49 pts/3    00:00:00 /usr/pgsql-10/bin/postgres -D /DATA
postgres  11562  11561  0 15:49 ?        00:00:00 postgres: logger process
postgres  11563  11561  0 15:49 ?        00:00:00 postgres: startup process   recovering 000000010000000000000019
postgres  11564  11561  0 15:49 ?        00:00:00 postgres: checkpointer process
postgres  11565  11561  0 15:49 ?        00:00:00 postgres: writer process
postgres  11566  11561  0 15:49 ?        00:00:00 postgres: stats collector process
postgres  11567  11561  0 15:49 ?        00:00:00 postgres: wal receiver process   streaming 0/190001B0
postgres  11571  11561  0 15:49 ?        00:00:00 postgres: wal sender process postgres 192.168.2.4(53982) streaming 0/190001B0
postgres  11637  11479  0 15:56 pts/3    00:00:00 ps -ef
postgres  11638  11479  0 15:56 pts/3    00:00:00 grep --color=auto postgres
4.this command will be helpful for how many wal segment get postgres receiver
ps -ef|grep receiver;
postgres   6757   6106  0 21:28 ?        00:00:00 postgres: wal receiver process
postgres   6791   5741  0 21:30 pts/1    00:00:00 grep --color=auto receiver
[postgres@slave1 bin]$ ps -ef|grep sender;
postgres   6133   6106  0 20:34 ?        00:00:00 postgres: wal sender process postgres 192.168.2.3(57544) streaming 0/18017CD8
postgres   6797   5741  0 21:30 pts/1    00:00:00 grep --color=auto sender
5.If the slave is up in hot standby mode, you can tell the time in seconds the delay of transactions applied on the slave with this query:
 select now() - pg_last_xact_replay_timestamp() AS replication_delay;
 replication_delay
-------------------
 05:52:20.985096
(1 row)
6.this view only work in slave means where is wal receiver running:
select status,receive_start_lsn,received_lsn,last_msg_send_time,latest_end_lsn,latest_end_time,conninfo from pg_stat_wal_receiver ;
  status   | receive_start_lsn | received_lsn |        last_msg_send_time        | latest_end_lsn |         latest_end_time          |                                                                                             conninfo

-----------+-------------------+--------------+----------------------------------+----------------+----------------------------------+--------------------------------------------------------------------------------------------------------------------------------------------------------------------------------------------------
 streaming | 0/19000000        | 0/190175E8   | 2018-03-15 10:00:21.770217+05:30 | 0/190175E8     | 2018-03-15 09:33:46.858319+05:30 | user=postgres password=******** dbname=replication host=192.168.2.2 port=5432 fallback_application_name=walreceiver sslmode=prefer sslcompression=1 krbsrvname=postgres target_session_attrs=any
(1 row)
Note: above timing is noted for last 5 hours slave not get any transaction
At Slave_2:
1.postgres=# \dt
        List of relations
 Schema | Name | Type  |  Owner
--------+------+-------+----------
 public | t    | table | postgres
(1 row)

postgres=# select pg_is_in_recovery();
 pg_is_in_recovery
-------------------
 t
(1 row)

postgres=# insert into t values(1);
ERROR:  cannot execute INSERT in a read-only transaction
2.
select client_addr,client_hostname,client_port,state,sent_lsn,write_lsn,flush_lsn,replay_lsn,write_lag,replay_lag,flush_lag,sync_state from pg_stat_replication;
client_addr | client_hostname | client_port | state | sent_lsn | write_lsn | flush_lsn | replay_lsn | write_lag | replay_lag | flush_lag | sync_state
-------------+-----------------+-------------+-------+----------+-----------+-----------+------------+-----------+------------+-----------+------------
(0 rows)
3.
$ ps -ef|grep postgres
root       6312   3361  0 09:30 pts/0    00:00:00 su postgres
postgres   6313   6312  0 09:30 pts/0    00:00:00 bash
postgres  11809   6313  0 15:43 pts/0    00:00:00 tail -f log/postgresql-Fri.log
root      11845  11810  0 15:44 pts/2    00:00:00 su postgres
postgres  11846  11845  0 15:44 pts/2    00:00:00 bash
postgres  11927      1  0 15:49 pts/2    00:00:00 /usr/pgsql-10/bin/postgres -D /DATA
postgres  11928  11927  0 15:49 ?        00:00:00 postgres: logger process
postgres  11929  11927  0 15:49 ?        00:00:00 postgres: startup process   recovering 000000010000000000000019
postgres  11930  11927  0 15:49 ?        00:00:00 postgres: checkpointer process
postgres  11931  11927  0 15:49 ?        00:00:00 postgres: writer process
postgres  11932  11927  0 15:49 ?        00:00:00 postgres: stats collector process
postgres  11933  11927  0 15:49 ?        00:00:00 postgres: wal receiver process   streaming 0/190001B0
postgres  12050  11846  0 15:58 pts/2    00:00:00 ps -ef
postgres  12051  11846  0 15:58 pts/2    00:00:00 grep --color=auto postgres
4.
[postgres@slave2 DATA]$ ps -ef|grep receiver
postgres   6397   6392  0 20:34 ?        00:00:04 postgres: wal receiver process   streaming 0/18017CD8
postgres   7107   6313  0 21:32 pts/0    00:00:00 grep --color=auto receiver
5.If the slave is up in hot standby mode, you can tell the time in seconds the delay of transactions applied on the slave with this query:
 select now() - pg_last_xact_replay_timestamp() AS replication_delay;
 replication_delay
-------------------
 05:52:37.884712
(1 row)
Next Post is: